
2015 Finance Report
Overview
This is the 2015 financial report for Quartz Hill Community Church. It starts with this overview of the year. Following the overview there is detailed information about fund balances and the budget.
2015 was an awesome year financially. It greatly improved upon a good 2014. Giving continued to be decent with a total General Fund income of $85,048, just off our budget of $87,230. Unfortunately our pastor decided to move away in late summer. Financially, however, this greatly reduced expenses so that we are able to be financially ready for a new pastor. The net result is that we ended the year with $11,761 in the General Fund.
The renovation project begun in 2014 continued throughout 2015. Financially we received $6,530 for our Renovation Fund. Work through the early part of the year finished wall and floor improvements. In addtion we have some new furniture, new window coverings, and cleaned out our old kitchen. The later part of the year was quieter as we built funds for a kitchen remodel. The Renovation Fund balance stands at $5,556.
Our debt load continues to decrease. Our building mortgage now has a balance of $6,470 and we are on track to pay it off on or before its maturity in November 2016. Our parsonage mortgage has a balance of $41,750. Keeping up with our very manageable $600 per month payment will pay it off on schedule April 2024.
As usual we continue to reach out to our community and around the world. Through our Deacons Fund we gave $1,458 to help the needy in our community. We also sent $874 to Southern Baptist cooperative programs.
Looking ahead we have funds to get the parsonage in shape and be ready for a new pastor who will hopefully come this year. The Renovation Fund has enough for our kitchen remodel and that should happen early in 2016. Financially we are comfortably stable and look forward to another good year.
Balances
The table below shows the balances of the various QHCC funds at the end of each month in 2015. The chart below the table shows the General Fund history. The chart includes unpaid bills in the General Fund balance to show when we are behind. All funds are contained in the QHCC Account, which means that the QHCC Account column is a total of the rest. Most income and spending occurs through the General Fund.
The Parsonage Fund has funds primarily from parsonage refinancing and is used to care for and maintain the parsonage. The Deacon Fund is usually donated to every communion service and is used to help people in need. At the 2008 budget meeting we voted to set up the Holding Fund. It is designed to hold funds needed to pay irregular large bills such as the property tax. Periodically youth at the church raise money and this money is stored in the Youth Fund.
The Internet and Temporary Funds should normally show zero balances. The Internet Fund tracks Quartz Hill School of Theology's support for our internet fees. The Temporary Fund covers money taken in for things not budgeted, such as Souper Bowl or the Lottie Moon offering. The high Temporary Fund balance shown is primarily money we have in the Renovation Fund.
| Date | QHCC Account | General | Gen - Hold | Parsonage | Deacon | Holding | Youth | Internet | Temporary |
|---|---|---|---|---|---|---|---|---|---|
| Dec-14 | 7,749 | 1,058 | 1,057 | 385 | 865 | 0 | 260 | (0) | 5,181 |
| Jan-15 | 7,188 | 197 | 197 | 385 | 865 | 0 | 260 | (0) | 5,481 |
| Feb-15 | 7,151 | (42) | (43) | 385 | 917 | 0 | 260 | (0) | 5,631 |
| Mar-15 | 10,752 | 2,599 | 2,598 | 385 | 917 | 0 | 260 | (0) | 6,591 |
| Apr-15 | 7,898 | 4,680 | 4,680 | 385 | 917 | 0 | 260 | (0) | 1,656 |
| May-15 | 9,012 | 5,353 | 5,352 | 385 | 358 | 0 | 260 | (0) | 2,656 |
| Jun-15 | 9,457 | 6,016 | 6,015 | 385 | (60) | 0 | 260 | (0) | 2,856 |
| Jul-15 | 9,929 | 6,428 | 6,427 | 385 | (0) | 0 | 260 | (0) | 2,856 |
| Aug-15 | 12,032 | 8,377 | 8,376 | 385 | 4 | 0 | 260 | (0) | 3,006 |
| Sep-15 | 12,436 | 5,965 | 4,265 | 385 | 69 | 1,700 | 260 | (0) | 5,756 |
| Oct-15 | 16,328 | 9,879 | 7,492 | 385 | 47 | 2,387 | 260 | (0) | 5,756 |
| Nov-15 | 18,047 | 11,599 | 11,192 | 385 | 47 | 407 | 260 | (0) | 5,756 |
| Dec-15 | 19,201 | 12,753 | 11,761 | 385 | 47 | 991 | 260 | (0) | 5,756 |
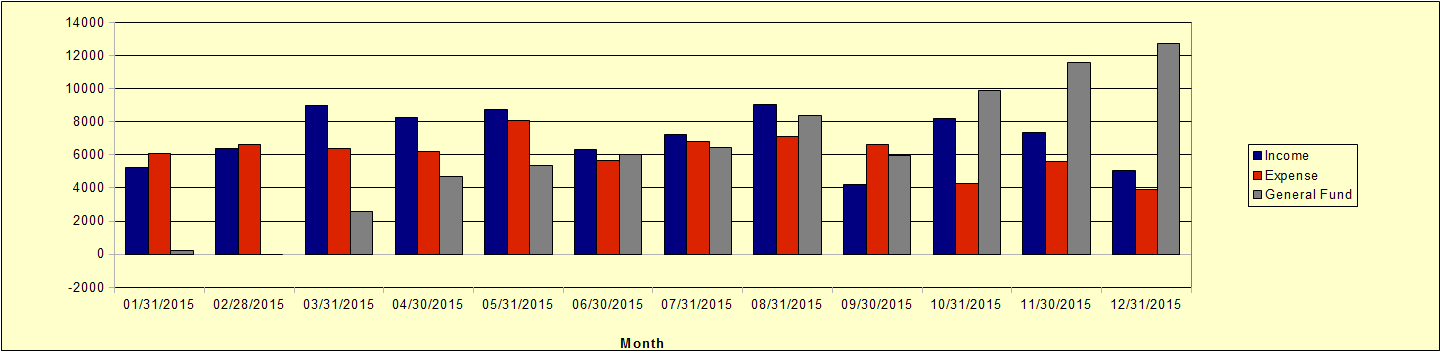
Here is the chart showing the General Fund balances, income and expenses throughout the year.
Budget
This table shows the how income and spending compare with the budget throughout the year. The left-hand column shows the budget categories and sub-categories. Next to it the Budget Column shows the monlthy budgeted amounts for each category. The next columns show the income and spending for each month. The Total YTD Column shows the total income and spending for the year to date. The Budget YTD Column shows the amount budgeted for the year to date. The Difference Column shows the difference between actual income and spending and the budget for the year to date. The Annual Budget Column shows the yearly budget amounts.
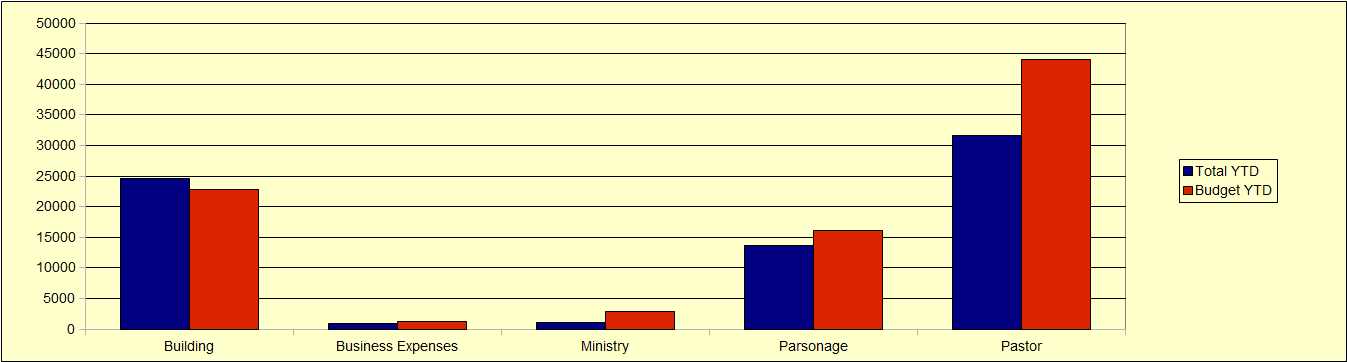
This chart shows spending compared to the budget for the major budget categories.
Copyright © Quartz Hill Community Church. All Rights Reserved.