
2014 Finance Report
Overview
This is the 2014 financial report for Quartz Hill Community Church. It starts with this overview of the year. Following the overview there is detailed information about fund balances and the budget.
2014 was a very good year financially. We came out of 2013 with a positive balance and a relatively stable base. Early in 2014 we received a large gift which was applied to purchasing new flooring for our building. The contributions of many members (both financially and personal effort) expanded this into a much needed building restoration project. Despite such giving for renovation our General Fund cash flow for most of the year was positive. From April through August our General Fund grew from $1,269 to $3,858. From September through the end of the year cash flow was more varied. The result was that we ended the year with a decent $1,058 balance, only slightly down from our 2013 year-end balance of $1,100. Another sign of our good year is that this is the first year since at least 2005 that our month-end balance never went negative. Throughout the year we also paid our bills on time. We can thank God that he got us through tough years like 2008 and 2010-2011 and has given us greater financial stability.
As mentioned above we undertook a major renovation project this year. In 2014 we received whopping $12,312 for renovation. Of that $8,118 has been spent with another $4,850 tagged for the remaining flooring expense. With the money spent we have had half the flooring installed. We also, with tremendous effort by many individuals, have significantly upgraded many other facets of the building.
Our debt load continues to decrease. Our building mortgage now has a balance of $14,471 and we are on track to pay it off on or before its maturity in November 2016. Our parsonage mortgage has been repackaged from a balloon loan to one that is amortized for 10 years (matures April 2024). It has a balance of $46,500 and we make a very manageable payment of $600 per month.
As usual we continue to reach out to our community and around the world. Through our Deacons Fund we gave $398 to help the needy in our community. We also sent $894 to Southern Baptist cooperative programs. A small amount of $45 was sent for the Mojave mission, as interest and communication with the mission dropped off.
Looking ahead we can hope and pray for continued financial stability and renovation efforts. The generosity our members (and others) have displayed this year is a testament to the grace of the God we serve.
Balances
The table below shows the balances of the various QHCC funds at the end of each month in 2014. The chart below the table shows the General Fund history. The chart includes unpaid bills in the General Fund balance to show when we are behind. All funds are contained in the QHCC Account, which means that the QHCC Account column is a total of the rest. Most income and spending occurs through the General Fund.
The Parsonage Fund has funds primarily from parsonage refinancing and is used to care for and maintain the parsonage. The Deacon Fund is usually donated to every communion service and is used to help people in need. At the 2008 budget meeting we voted to set up the Holding Fund. It is designed to hold funds needed to pay irregular large bills such as the property tax. Currently we are behind in our bills so the Holding Fund has no money. Periodically youth at the church raise money and this money is stored in the Youth Fund.
The Internet and Temporary Funds should normally show zero balances. The Internet Fund tracks Quartz Hill School of Theology's support for our internet fees. The Temporary Fund covers money taken in for things not budgeted, such as Souper Bowl or the Lottie Moon offering.
| Date | QHCC Account | General | Gen - Hold | Parsonage | Deacon | Holding | Youth | Internet | Temporary |
|---|---|---|---|---|---|---|---|---|---|
| Dec-13 | 3,659 | 1,093 | 1,093 | 385 | 934 | 0 | 260 | (0) | 986 |
| Jan-14 | 2,634 | 227 | 227 | 385 | 836 | 0 | 260 | (61) | 986 |
| Feb-14 | 8,564 | 5,137 | 5,137 | 385 | 868 | 0 | 260 | (122) | 2,036 |
| Mar-14 | 13,227 | 2,478 | 2,478 | 385 | 868 | 0 | 260 | (0) | 9,236 |
| Apr-14 | 7,148 | 1,269 | 1,269 | 385 | 938 | 0 | 260 | (0) | 4,296 |
| May-14 | 7,945 | 1,548 | 1,548 | 385 | 938 | 0 | 260 | (0) | 4,814 |
| Jun-14 | 8,370 | 1,973 | 1,973 | 385 | 938 | 0 | 260 | (0) | 4,814 |
| Jul-14 | 9,300 | 3,177 | 3,177 | 385 | 1,013 | 0 | 260 | (0) | 4,464 |
| Aug-14 | 10,060 | 3,858 | 3,858 | 385 | 1,013 | 0 | 260 | (0) | 4,544 |
| Sep-14 | 9,160 | 2,647 | 2,647 | 385 | 1,049 | 0 | 260 | (0) | 4,819 |
| Oct-14 | 9,425 | 2,512 | 2,512 | 385 | 1,049 | 0 | 260 | (0) | 5,219 |
| Nov-14 | 6,842 | 1 | 1 | 385 | 865 | 0 | 260 | (0) | 5,331 |
| Dec-14 | 7,749 | 1,058 | 1,058 | 385 | 865 | 0 | 260 | (0) | 5,181 |
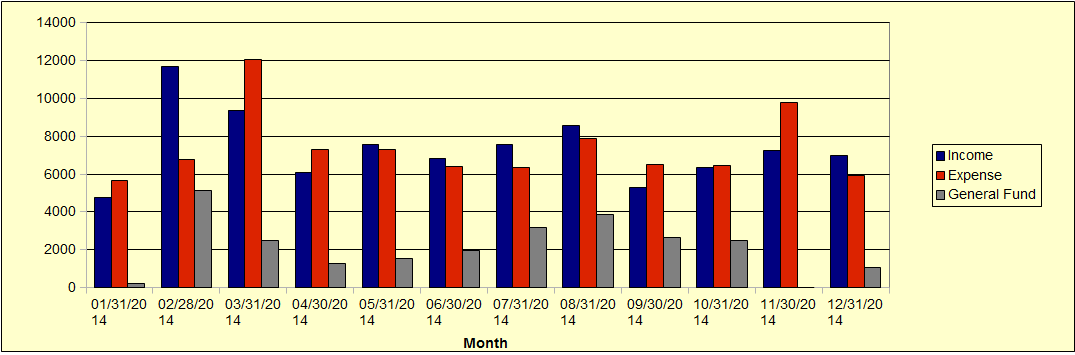
Here is the chart showing the General Fund balances, income and expenses throughout the year.
Budget
This table shows the how income and spending compare with the budget throughout the year. The left-hand column shows the budget categories and sub-categories. Next to it the Budget Column shows the monlthy budgeted amounts for each category. The next columns show the income and spending for each month. The Total YTD Column shows the total income and spending for the year to date. The Budget YTD Column shows the amount budgeted for the year to date. The Difference Column shows the difference between actual income and spending and the budget for the year to date. The Annual Budget Column shows the yearly budget amounts.
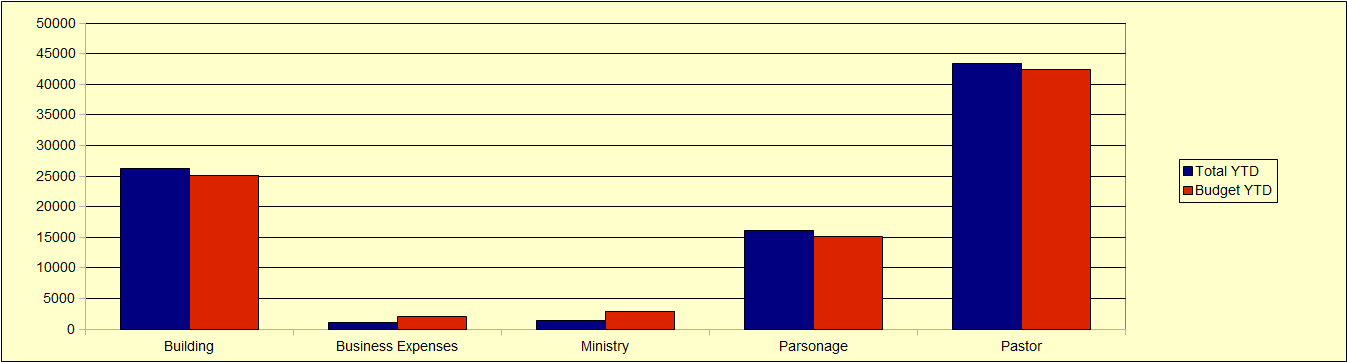
This chart shows spending compared to the budget for the major budget categories.
Copyright © Quartz Hill Community Church. All Rights Reserved.