
2008 Finance Report
Overview
This is the 2008 financial report for Quartz Hill Community Church. It starts with this overview of the year. Following the overview there is detailed information about fund balances and the budget.
2008 was a tough year for our church. We fell behind on some bills, especially our building mortgage. During the summer we were unable to make any building mortgage payment. This put us several thousand dollars in the red. Suntrust, our building mortgage holder, allowed us to reduce our payments for six months so we could catch up. Treasurer reports were made weekly throughout the year since we were always behind.
Despite 2008 being a bad year there were several positives. First, we survived the winter rains better than ever thanks to the new roof we installed in late 2007. Many of us continued to praise God for the roof as heavy rains and snow fell again this December.
At the end of the year our building mortgage improved somewhat. Suntrust, our building mortgage holder, allowed us to reduce our payments for six months so we could catch up. We have been able to catch up a bit, reducing our outstanding balance to $1,875.
Giving also recovered in the fall. This is normal for our church, but does fly counter to what happened to the economy in general. In the fall we were able to pay all our bills. We also caught up on our insurance, paid our property tax and reduced our building mortgage. After having a net negative balance for most of the year we ended December positive. At the end of 2008 we had $2,082 in General Fund and $1,875 in overdue building mortgage, which means had a net balance of $207. God took good card of us, in spite of how the rest of the economy did during this time.
Balances
The table below shows the balances of the various QHCC funds at the end of each month in 2008. The chart below the table shows the General Fund history. The chart includes unpaid bills in the General Fund balance to show when we are behind. All funds are contained in the QHCC Account, which means that the QHCC Account column is a total of the rest. Most income and spending occurs through the General Fund.
The Parsonage Fund has funds primarily from parsonage refinancing and is used to care for and maintain the parsonage. The Deacon Fund is usually donated to every communion service and is used to help people in need. At the 2008 budget meeting we voted to set up the Holding Fund. It is designed to hold funds needed to pay irregular large bills such as the property tax. Currently we are behind in our bills so the Holding Fund has no money. Periodically youth at the church raise money and this money is stored in the Youth Fund.
The DSL and Temporary Funds should normally show zero balances. The DSL Fund has a negative balance because Quartz Hill School of Theology is responsible for our DSL fees and is behind in reimbursing QHCC. The Temporary Fund covers money taken in for things not budgeted, such as Souper Bowl or the Lottie Moon offering.
| Date | QHCC Account | General | Parsonage | Deacon | Holding | Youth | DSL | Temporary |
|---|---|---|---|---|---|---|---|---|
| 12/31/2007 | 3,256 | 451 | 2,861 | 704 | 0 | 75 | (835) | 0 |
| 1/31/2008 | 4,007 | 1,140 | 2,861 | 704 | 0 | 75 | (775) | 2 |
| 2/28/2008 | 2,994 | 364 | 2,861 | 374 | 0 | 110 | (715) | 0 |
| 3/31/2008 | 2,978 | 261 | 2,861 | 437 | 0 | 74 | (655) | 0 |
| 4/30/2008 | 2,916 | 160 | 2,861 | 437 | 0 | 74 | (615) | 0 |
| 5/31/2008 | 2,391 | (432) | 2,861 | 468 | 0 | 30 | (535) | 0 |
| 6/30/2008 | 3,927 | 577 | 3,161 | 505 | 0 | 30 | (345) | 0 |
| 7/31/2008 | 4,254 | 722 | 3,161 | 629 | 0 | 147 | (405) | 0 |
| 8/31/2008 | 5,129 | 1,557 | 3,161 | 629 | 0 | 247 | (465) | 0 |
| 9/30/2008 | 4,726 | 974 | 3,161 | 629 | 0 | 257 | (295) | 0 |
| 10/31/2008 | 3,471 | 454 | 2,461 | 655 | 0 | 257 | (355) | 0 |
| 11/30/2008 | 6,264 | 2,717 | 2,461 | 710 | 0 | 552 | (175) | 0 |
| 12/31/2008 | 5,532 | 2,082 | 2,461 | 710 | 0 | 514 | (235) | 0 |
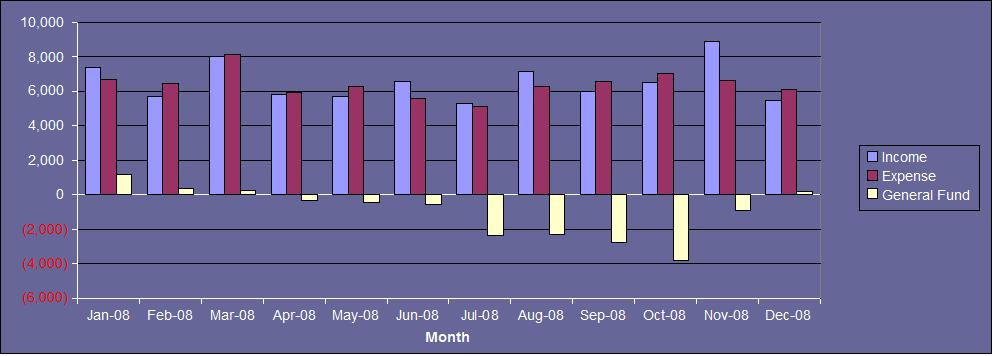
Here is the chart showing the General Fund balances, income and expenses throughout the year.
Budget
This table shows the how income and spending compare with the budget throughout the year. The left-hand column shows the budget categories and sub-categories. Next to it the Budget Column shows the monlthy budgeted amounts for each category. The next columns show the income and spending for each month. The Total YTD Column shows the total income and spending for the year to date. The Budget YTD Column shows the amount budgeted for the year to date. The Difference Column shows the difference between actual income and spending and the budget for the year to date. The Annual Budget Column shows the yearly budget amounts.
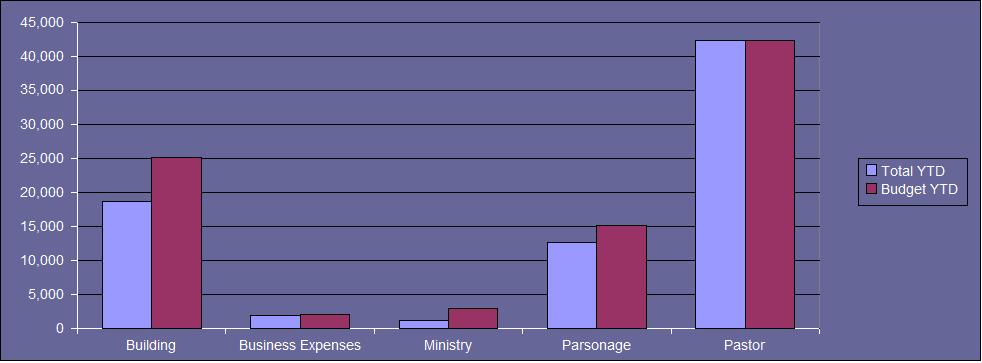
This chart shows spending compared to the budget for the major budget categories.
Copyright © Quartz Hill Community Church. All Rights Reserved.